Bio-IT World Asia 2013
Mar 1st, 2013 |
![]()
I am an invited speaker at the Bio-IT World Asia 2013 conference in the Bioinformatics and Cancer Genomics track, in Singapore May 28-31, 2013.

![]()
I am an invited speaker at the Bio-IT World Asia 2013 conference in the Bioinformatics and Cancer Genomics track, in Singapore May 28-31, 2013.
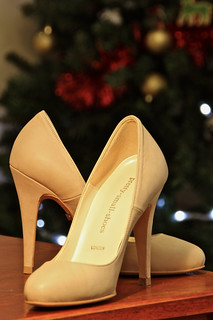
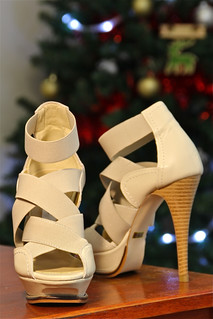
Finding fantastic shoes in smaller sizes just got a whole lot easier for me in Australia: Pretty Small Shoes (UK) is shipping internationally for a very reasonable price (this time it was even free) and seems to have a sensible return policy (did not need it so far). Here are my first two shoes I got from them for Christmas:
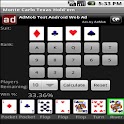
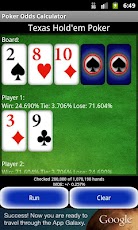
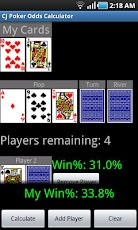
Calculating the odds of winning a poker game given the cards you have is pretty handy especially for beginners or casual players. There are several desktop applications out there (see review of Poker Odds Calculators), however, calculating the odds at the table in a game on the fly using mobile applications for Poker Odds Calculations is the real world application.
Here I review five popular apps for Android.
 |
 |
 |
 |
 |
|
| App Name | Poker Odds Calculator | Poker Odds Calculator | CJ Poker Odds Calculator |
Monte Carlo Texas Hold’em | texas holdem odds calculator |
| Version | 1.30 | 2.0.1 | 1.2 | 1.3 | 1.0.1 |
| Developer | Perun Labs | lyleapps | CJ Cheng | GreenBean | Mammut Software |
| Last Update | Dec 22, 2012 | Aug 5, 2012 | Jan 30, 2011 | Jul 28, 2011 | Jan 1, 2013 |
| Rating | 4.6 (795) | 4.4 (381) | 4.0 (142) | 3.7 (80) | 5.0 (2) |
| Screenshot | 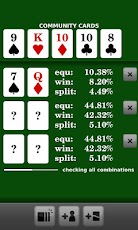 |
 |
 |
 |
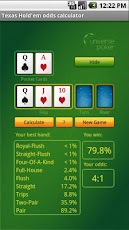 |
| App Permissions | Full Network Access | Full Network Access | None | None | None |
| Android Version | 2.0.1 and up | 2.0 and up | 1.6 and up | 1.6 and up | 1.6 and up |
| Required Input | Hand | Hand | Hand | Hand | Hand |
| Optional Input | opponent’s Hand, Flop, River and Turn | opponent’s Hand, Flop, River and Turn | opponent’s Hand, Flop, River and Turn | Flop, River and Turn | Flop, River and Turn |
| Output | win, tie | win, tie | win | win | win, odds |
| Method | Calculation with approximation shown instantly | Calculation and Monte Carlo simulations | Approximation | Monte Carlo simulations | Calculation and Monte Carlo simulations |
| Players | unlimited | 2 – 9 | 2 – 10 | 2 – 10 | 2 |
| Clicks for Card Selection | 2 | 2 | 2 | 2 | 1 |
| Hand Rank Information | ✔ | ||||
| Opponent’s Hand not Necessary | ✔ | ✔ | ✔ | ✔ | ✔ |
| Margin of Error for Simulations | ✔ | ✔ | |||
| Folding Adjustment | ✔ | ✔ | ✔ | ||
| Input Check* | ✔ | ||||
| Tablet Support | ✔ | ✔ | ✔ | ✔ | |
| Speed | instant approximation | adjustable accuracy | adjustable accuracy | ||
| Hide Own Cards | ✔ | ||||
| SD Card Install | ✔ | ✔ | ✔ | ||
| Discarded cards | ✔ | ✔ | |||
| No Adds in Free-Version | ✔ | ✔ | ✔ | ||
| Revenue | Adds | Adds | NA | NA | Poker Wear |
* Duplicate card checking is done by all but you can specify river and turn before flop for some.
Time of review Wed Jan 2 10:04:43 EST 2013
I have been playing with HTML5 for my new tool for alignment comparisons. To visualize the graphs I’m using flotr2 by HumbleSoftware.
Which produces an image like this — on the fly and without any actual graphic files:
The first thing you need to include in your page is the library. You can do that by either linking to a local file, linking to the HumbleSoftware file like so
<script type="text/javascript" src="http://www.humblesoftware.com/static/js/flotr2.min.js"></script>
or just pasting the content in the html
<script type="text/javascript">[content goes here]</script>
The next thing you need is the definition of the actual graph and its data
<script type="text/javascript">

(function basic_bars(container, horizontal) {

var horizontal = horizontal ? true : false,

d1=[[-0.100000,1288.000000],[0.900000,3693.000000],[1.900000,13324.000000],[2.900000,5110.000000],[3.900000,5062.000000],[4.900000,2281.000000],[5.900000,893.000000],[6.900000,493.000000],[7.900000,476.000000]],

d2=[[0.150000,25049.000000],[1.150000,2035.000000],[2.150000,4093.000000],[3.150000,628.000000],[4.150000,433.000000],[5.150000,201.000000],[6.150000,109.000000],[7.150000,73.000000],[8.150000,73.000000]],

point, i;

data = [{data:d1, label: "Original"}, {data:d2,label:"Corrected"}];

graph=Flotr.draw(container, data, {

legend: { position: "te"},

bars: {show: true, horizontal: horizontal, shadowSize: 0, barWidth: 0.250000},

mouse: {track: true, relative: true},

xaxis: {min: -1, max: 9, title: "# Mismatches"},

yaxis: {title: "# Reads",},

HtmlText: false,

});

})(document.getElementById("Mismatches"));</script>
There is a little bit of trickery to get the bars from the two different methods center around their common x-axis tick.
And finally the div tag so say where the image goes
<div id="Mismatches" style="width : 600px; height: 384px; margin: 8px auto;"></div>
Note that the document.getElementById and the id in the div need to have the same name.
These are the standards used, which you need to change to customize your plot.
Now in order to use the spread sheet function in the formatting it was intended to be, you need to also include the file content of https://raw.github.com/HumbleSoftware/Flotr2/master/examples/examples.css or include the css on the humbleSoftware webpage like so
<link rel="stylesheet" type="text/css" href="http://www.humblesoftware.com/static/css/hsd-flotr2.css" />
And enable the spreadsheet: {show:true}
For the image download as pngs or jpgs to work you need to include jquery as well, like so
<script type="text/javascript" src="https://ajax.googleapis.com/ajax/libs/jquery/1.7.2/jquery.min.js"></script>
And add a form to access the graph element you drew with flotr2. E.g.
<div>Download Image</div>

<div>

<form name="image-download" id="image-download" action="" onsubmit="return false">

<label><input name="format" value="png" checked="checked" type="radio"> PNG</label>

<label><input name="format" value="jpeg" type="radio"> JPEG</label>

<button name="to-image" onclick="CurrentExample('to-image')">To Image</button>

<button name="download" onclick="CurrentExample('download')">Download</button>

<button name="reset" onclick="CurrentExample('reset')">Reset</button>

</form>

</div>
And add this function after your graph in the basic_bars-fuction
this.CurrentExample = function(operation) {

var format = $("#image-download input:radio[name=format]:checked").val();

if (Flotr.isIE && Flotr.isIE < 9) {

alert("Your browser doesn't allow you to get a bitmap image from the plot, " + "you can only get a VML image that you can use in Microsoft Office.<br />");

}

if (operation == "to-image") {

graph.download.saveImage(format, null, null, true);

} else if (operation == "download") {

graph.download.saveImage(format);

} else if (operation == "reset") {

graph.download.restoreCanvas();

}

};

return graph;
See this stand-alone example.
NorahDesk
non-coding RNA detection from deep sequencing data
NorahDesk is a small non-coding RNA (ncRNA) detection tool for RNA sequencing (RNA-Seq) data, developed by my PhD student Chikako Ragan.
NorahDesk utilizes the coverage-distribution of small RNA sequence data and thermodynamic assessments of secondary structure to reliably predict and annotate ncRNA classes.
For more information visit the webpage.

All you need is … a ticket to this year’s TEDxBrisbane convergence.
Looking forward to meeting new people !!
 I am one of the three finalists for this year’s Infotech Research Award from Women in Technology (WiT). This is a particularly great honor because the other two finalists are Prof. Janet Wiles and Sandra Mau. I’m looking forward to a wonderfully inspiring evening at the gala dinner of the 14th annual WiT awards.
![]()
+++ UPDATE +++
Prof. Janet Wiles won … congratulations !!
image by lorns (#witawards)

Triplexator is a bioinformatics tool (by Fabian Buske) harnessing the power of a so far underutilized mechanism for sequence-specific DNA binding that is of great interest for biotechnological and gene-therapeutic applications.
This potent homing mechanism is provided by nucleic acids triple helices, also called triplexes, which are oligonucleotide complexes made of three strands of either DNA or RNA, originally described by Felsenfeld et al. [J. Am. Chem. Soc. 1957] and reviewed earlier this year [Buske et al. RNA Biology 2011].
Triplexator enables to study all aspects of nucleic triplex formation, i.e. (i) identify triplex-forming oligonucleotides (TFOs) in single-stranded nucleic acids, (ii) identify suitable target sites (TTS) in double-stranded sequence and, most importantly, (iii) assess the compatibility of the two participating partners according to canonical triplex formation rules (TFO/TTS pair).
More here.
 I am organizing QBI’s bioinformatics seminar series to give researchers a better understanding of bioinformatics, specifically with respect to second generation sequencing data production and analysis. By the end of the seminar series the researchers should have a better understanding of time frames, analysis steps and the research contribution that they can expect from the bioinformatics analysis for their projects.
Along with the seminar series, there will be a “walk-in-clinic” set up where you can ask bioinformatics questions and get some of the smaller tasks solved directly.
The seminar series and subsequent “walk-in-clinic” will be Thursdays 10am starting from the 16th June. More details on the CBG-webpage.

From Esteban Moro Egido blog "publish and perish"
Russ Altman from Stanford University has recently reviewed and presented the most interesting bioinformatics papers from 2010. While this is undoubtedly very subjective (obviously, because he did not mention any of my papers), it is an excellent practice and should be done in any research institute for all the topics that are of interest to this community. Staying informed about what actually is the cutting edge science, is paramount for real progress, rather than keep on using the same old hat, and being frustrated that the outcome never looks promising.
Speaking of promising, I particularly like a paper titled “Over-optimism in bioinformatics research.” that features in this “highlights of 2010″ list, which summarizes some of the things that are seriously wrong with the research community as a whole (not just bioinformatics): negative results are not easily publishable, this seduces “authors to find something positive in their study by performing numerous analyses until one of them yields positive results by chance, i.e. to fish for significance”. Also, positive results are all too willingly accepted while negative results are interrogated until they crack and pretend to be positives just for the publication. We all know that being a significance-fisher does not require too much interrogation skill because the evil sidekick “noise” is abundantly present in the types of data most of us work with. Contributing to this is the fact that most results are not reproducible once they are published. This I blame on unavailable code, software version changes, reference data update but most of all on the mad rush that is applied during data production and analysis because one might get scooped.
This brings us full circle with why a review of current research activity, “highlights of 20XX”, is paramount: knowing what others do gives us a better chance to position our research in an area that is truly new and unique, which means we have more time to form a solid hypothesis, do good science and then publish high confidence results only (positive or negative). However, the current “publish or perish” attitude makes this approach career suicide. But, there could be a shift towards “more quality than quantity” if the reviewers are briefed by their institute’s “highlights of 20XX” presentations to scrutinize bad science. So, since we are all reviewers at some stage, we can start making the first step towards good science at our next review ourselves.
